There are many strategies you can use to trade the Forex market. One strategy is to use Forex chart patterns that regularly occur in the market. These patterns show can you which direction the price may be going in. Some of these Forex patterns are:
Double Top
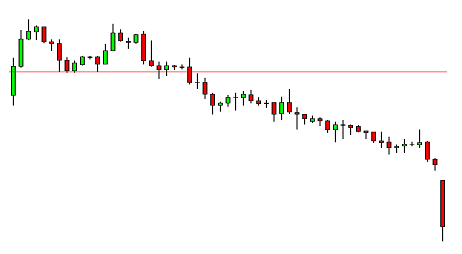
This is a pattern that forms after an uptrend. The tops are formed when the price reaches a certain level and can’t rise any higher. When the price reaches that level, it drops a little and then rises again to test the original level where it couldn’t move higher. If the price does not cross above the original level and moves downwards, then a double top is formed.

From the forex chart pattern above, you can see two tops formed after an uptrend. The second top has not crossed the high of the first top. This indicates a potential downward movement of price. The red line is the neckline. Traders can enter trades below the neckline.
Double Bottom
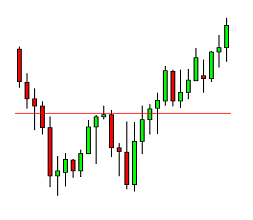
The double bottom is formed after a downtrend. Here, the price moves downwards until it reaches a point where it can’t drop any lower. The price bounces back and rises slightly and then drops again. When the price fails to cross below the low of the first bottom and begins to move upwards, then a double bottom is formed.

The forex chart pattern above shows two bottoms formed after a downtrend. The second bottom has not exceeded the low of the first bottom. This is an indication of decreased selling pressure. Here, traders can enter long positions above the neckline (red line).
Head and Shoulders
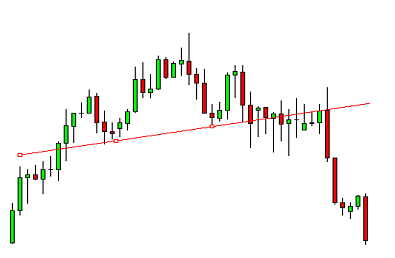
The head and shoulders is a trend reversal pattern which can be observed during uptrends. It is formed by three price peaks. The first peak is the first shoulder which is then followed by the second peak which is the head. The head is then followed by the third peak which is the third shoulder. The head is higher than both shoulders.

From the chart above, you can see the head which is higher than the two shoulders on its left and right side. The red line represents the neckline which acts as a signal for traders to enter their positions. Traders can enter short positions when the price crosses below the neckline.
Inverse Head and Shoulders
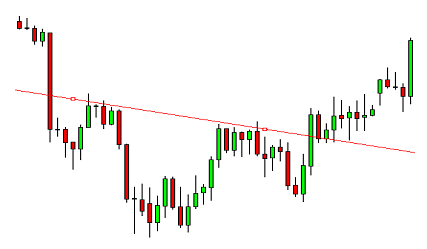
The inverse head and shoulders can be seen during downtrends. It is the opposite of head and shoulders, with price valleys instead of price peaks. The first valley is the first shoulder formed. It is then followed by the second valley (head) which is much lower, and finally, the third valley (shoulder) which is higher. In this case, the head is much lower than the two shoulders.

From the forex chart pattern above, traders can enter long positions when the price rises above the neckline in anticipation of an uptrend. When setting a profit target, measure the distance between the head and the neckline. This distance gives an estimate of how far the price will move once it crosses the neckline.
Final Thoughts on Forex Chart Patterns
Forex chart patterns are important as they can help traders make profits. But first, traders have to learn and understand them.
We hope you enjoyed this article. To read more about forex trading, take a look at our education section.
