Forex charts are used to study price changes during a chosen time period. For example, forex charts show minute, hourly, daily, weekly and monthly price movements. This helps traders predict future short term and long term price movements. The most common forex chart types are the line, bar, and candlestick charts.
About Forex Charts
Line Charts
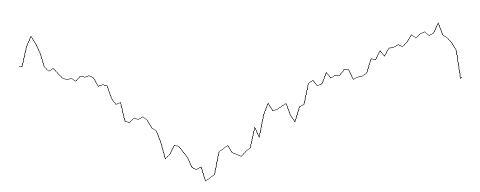
The most basic type of forex chart is the line chart. Line Charts show whether the market is in an uptrend, downtrend or in a range. However they also give minimal information. A line chart is formed by connecting one closing price to another. It does not show information such as the highs and lows of price in a specific time period.

Bar Charts
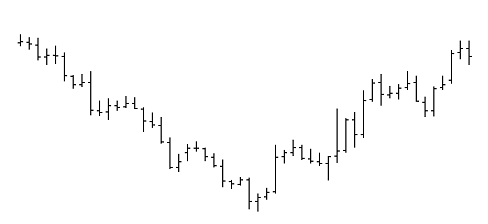
The second most basic type of forex chart is the bar chart. Bar charts give more detailed information about price movements. This is because they show the open, high, low, and close price. This is also why bar charts are often referred to as OHLC charts.
- Open: This is the opening price at the set timeframe.
- High: This is the highest price traded at the set timeframe.
- Low: This is the lowest price traded at the set timeframe.
- Close: This is the closing price of the currency at the set timeframe.

The price movement within the set time period is shown by the length of the bar. The high price is the top point of the bar, the opening price is the horizontal foot on the bar’s left side. The closing price is the horizontal foot on the bar’s right side. The low price is the bottom point of the bar.
Candlestick Charts
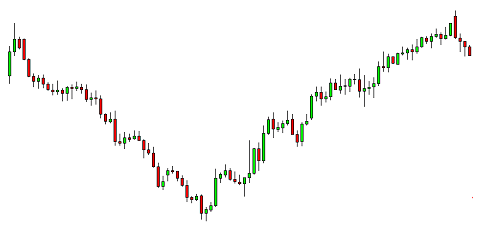
Another type of forex chart is the candlestick chart. This chart also has the open price, high, low and close price. However, the candlestick chart also uses colours to indicate price direction. The most common colour for a bullish candlestick is either green or white, while the most common colour for a bearish candle is either red or black.
In a bullish candle, the closing price closes above the open price while in a bearish candle, the closing price closes below the open price.
- Open: This is the opening price at the set time frame.
- Close: This is the closing price at the set time frame.
- High: This is the highest level price reached at the set time frame.
- Low: This is the lowest level price reached at the set time frame.
- Body: Is the distance between the opening and closing prices.
- Shadow: These are the thin lines above and below the body of the candlestick.

Final Thoughts on Forex Charts
Line charts, bar charts, and candlestick charts are all important forex charts. Each of them has its own advantages and you can choose which type of forex chart you want to work with based on your personal preference.
We hope you enjoyed this article. To learn more about forex trading, take a look at our education section.
