There are different ways to analyse price movement in the Forex market. Technical analysis is one way to do it. It involves studying the historical price movement to determine the probable future price movement. Line charts, bar charts, and candlestick charts are applied in technical analysis. They help in showing price fluctuations across different time frames. One very popular chart is the candlestick chart.
What is a Japanese Candlestick Chart?
Japanese candlestick charting was used back in the 18th century by a rice trader called Munehisa Homma to trade Japan’s financial instruments. Steve Nison later introduced Japanese candlesticks to western traders through his book, “Japanese Candlestick Charting Techniques”. Japanese candlesticks analyse price movement by graphically displaying the fluctuating prices at the set time frames. This can be better explained through the diagram below:
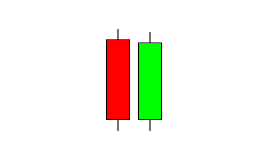
Interpretation of the Candlestick
- Body. This is the distance between the opening and closing prices.
- Open. This is the opening price at the set time frame.
- Close. This is the closing price at the set time frame.
- High. This is the highest level price reached at the set time frame.
- Low. This is the lowest level price reached at the set time frame.
- Wicks (Shadows). These are the thin lines above and below the body of the candlestick.
- The green body above indicates an upward move in the price as the close price is higher than the open price.
- The red body above indicates a downward move in price as the close price is lower than the open price.
Bullish Candlestick Patterns
Bullish candlestick patterns indicate the potential rise in price and that buyers are gaining control of the market. They are listed below:
- Hammer
- Bullish engulfing pattern
- Tweezer bottoms
- Piercing pattern
- Morning star
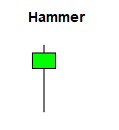
This bullish pattern forms during the end of a drop in price. It indicates the potential rise in price. The long lower shadow shows that initially, the sellers had pushed the price lower, but the buyers regained control and pushed the price up to close near the open price. The long lower shadow is 2 to 3 times the length of the body. The range of the upper shadow is either small or not present.
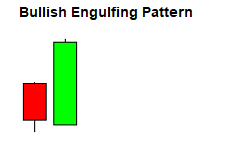
This is a pattern formed by 2 candles, where a long bullish candle completely engulfs the previous bearish candle. It is located at the end of a price decline. The previous bearish candle indicates that the sellers were in control. However, the next bullish candle shows increased buying pressure by closing above the previous candle’s high. This means buyers are in control and there is potential for price to rise.
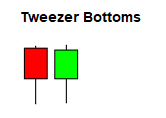
This bullish pattern is formed by two candlesticks with the same length. It occurs at the end of a downward trend. The first candle indicates an increase in short positions trading in the downward trend. Hence, the price drops. However, there is some buying pressure which causes the price to rise but not enough to close above the open price. The second candle indicates sellers were overcome by buying pressure. The price does not fall below the previous low. The buying pressure pushes the price higher which closes above the open price.
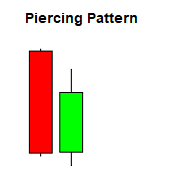
This is a dual candlestick pattern that forms after a price decline. The first candle is bearish. Traders enter short positions following the downtrend hence bearish close. In the second candle (bullish), traders enter long positions which pushes the price higher and closes above the midpoint of the previous candle.
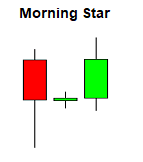
This is a triple candlestick pattern. The first candle is bearish continuing in the general direction of the decline. Its body range is long. The sellers are in control. The second candle shows indecision in the market. The range of its body is small and the candle can either be bearish or bullish. The third candle closes above the midpoint of the first bearish candle. This is due to increased buyers’ pressure overwhelming sellers. The body range of the candle is long.
Bearish Candlestick Patterns
Bullish candlestick patterns show that buyers are gaining control of the market. They are:
- Shooting star
- Bearish engulfing pattern
- Tweezer tops
- Dark cloud cover
- Evening star
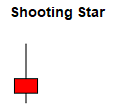
This is a single candlestick pattern formed at the end of an uptrend. It is characterised by a small or no lower shadow and the body is also small. Additionally, the range of the upper shadow is 2 to 3 times the size of the body. Initially, traders entered long positions which raised the prices higher. However, sellers’ pressure overwhelms buyers’ pressure. This causes the price to be pushed lower to a point where it closes below the open price.
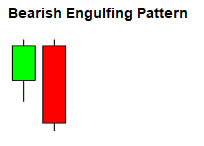
This is a dual candlestick pattern where the body of the first candle is completely engulfed by the body of the second candle. The first candle closes at a higher price which signifies that buying pressure was high during that time frame. The second candle is bearish. It indicates a strong selling pressure which overcomes the buyers. This pushes the price lower than the previous candle’s low.
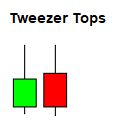
This candlestick pattern is the opposite of tweezer bottoms. It occurs at the end of an uptrend. The first candlestick is similar to the general direction of the market which in this case is an uptrend. Therefore, it is bullish. Traders entered long positions which raised the price. However, there was some selling pressure which pushed the price lower but not enough to close below the open price. The second candlestick indicates buyers tried to drive the price higher but were overcome by increased selling pressure. This pushed the price lower and signified a potential drop in price.
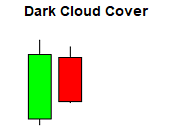
This candlestick pattern forms at the end of an uptrend. The first candle closed higher on that time frame since buyers entered long positions that pushed the price. The second candle shows increased selling pressure which caused the price to fall below the midpoint of the previous bullish candlestick. This indicates a potential drop in price.
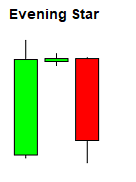
This is a triple candlestick pattern found at the end of an uptrend. The first candlestick is bullish and has a long body. It forms during an uptrend. Long positions were entered which drove the price higher on the overall trend. The second candlestick has a small body and represents indecision in the market concerning the direction of price. It is either bullish or bearish. The third candlestick is bearish and has a long body. It closes below the midpoint of the first bullish candlestick. Increased selling pressure is what pushed the price lower.
Final Thoughts
Learning different types of candlestick patterns is important for a trader’s success. However, it is recommended to combine candlestick patterns with other trading tools in order to increase the potential of profiting in the market.
We hope you enjoyed this article on Japanese Candlesticks. To read more, check out our forex education section. To start trading, find our list of best forex brokers here.
