Forex traders analyse the market using either technical analysis or fundamental analysis. Technical analysis involves studying historical price movements while fundamental analysis involves studying news events. Technical analysis mostly involves using technical indicators to determine the probability of a price moving in a certain direction. The indicators apply mathematical formula where the calculations are based on price.
Technical Indicators can either be lagging or leading indicators. Lagging indicators follow price movement and provide signals after the trend has already begun. Examples are Moving Averages and Bollinger Bands. Leading indicators, on the other hand, can be used to forecast price movement and give signals before a trend has started. Examples are Relative Strength Index and Stochastics Oscillators.
How To Use Technical Indicators When Trading Forex
There are many technical indicators available in MetaTrader. Some of the most used indicators include;
1. Moving Average (MA)
From its name, this indicator measures the average price of a financial instrument over a specified time period. One principle of technical analysis is that price moves in trends. Therefore, a moving average is essential for finding and following a trend.
The types of moving average are;
- Simple Moving Average
- Exponential Moving Average
- Smoothed Moving Average
- Linear Weighted Average
Some of the popular time periods when setting up moving average are 10, 20, 50, 100 and 200. The short time periods such as 10 and 20 analyse short-term trends while long time periods like 200 show long-term trends.
How to Use Moving Averages
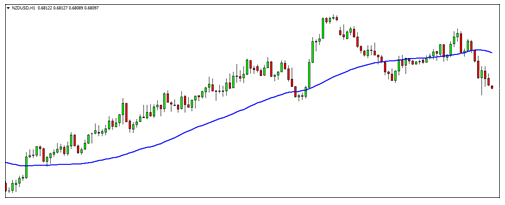
In an uptrend, the price action is usually above the moving average.
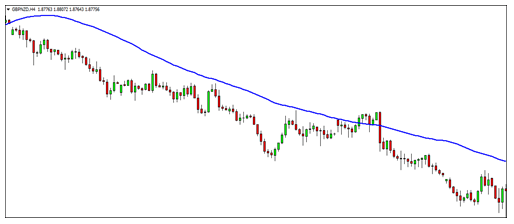
In a downtrend, the price action is below the moving average.
A better way of using moving averages is adding more to the chart. If there is a crossover, a new trend is likely to be formed. For example;
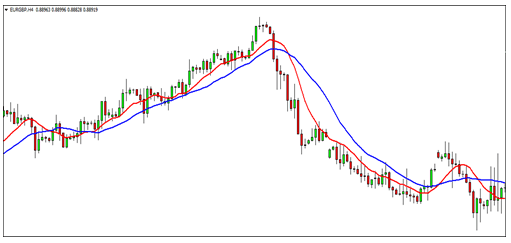
From the chart above, the 10 day SMA is red while 20 day SMA is blue. When the market is rising, the faster MA is above the slow moving MA while in a downtrend, the slower MA is above the fast moving MA. A signal to buy is when the 10 SMA crossed above the 20 SMA. The signal to sell is when the 10 SMA crossed below the 20 SMA.
2. Relative Strength Index (RSI)
This technical indicator shows whether a financial instrument has been overbought or oversold in the market. Its scale ranges from 0 to 100. However, the levels monitored are 30 and 70.
An oversold condition is identified when the RSI line crosses below level 30 whereas an overbought condition is recognized when the RSI line crosses above level 70.
How to Use Relative Strength Index
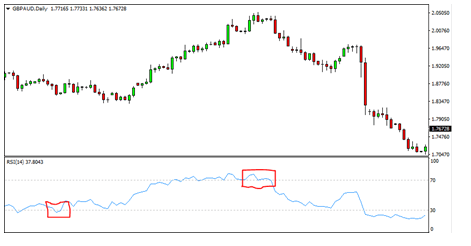
The above GBP/AUD daily chart indicates both overbought and oversold conditions. The RSI line crossed below level 30 which signalled an oversold market. This indicates the price is likely to rise. Hence, you buy when the RSI line is out of the oversold area. As you can see, the price rose afterwards. When the RSI line crossed above level 70, it indicated an overbought market. The best time to sell is when the line crosses below level 70 and is out of the overbought area. From the chart above, the price decreased onwards.
3. Bollinger Bands
This technical indicator is used to check on the volatility of the market. They consist of 3 lines. The lower band, upper band and the moving average in the middle. Both lines are moving averages. The difference in standard deviation shifts the 3 lines to different positions. The upper and lower bands act as resistance and support levels respectively. A low volatile market is evidenced by bands that contract and are closer to each other. An expansion of the bands is brought about by the increase in price volatility.
How to Use Bollinger Bands
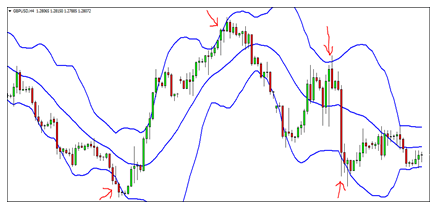
When the price moves closer to the upper band, it signifies the financial instrument has been overbought. Therefore, a reversal will likely take place. This may act as a signal to sell. Price movement towards the lower band indicates that the price may start to rise. Narrowing of the bands is usually a signal that price will move sharply, either up or down.
4. Moving Average Convergence Divergence (MACD)
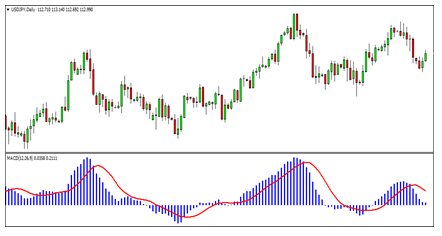
This technical indicator is used to identify a trend and also measure the strength of a trend. The MACD histogram is got from the difference between the 26 day EMA and the 12 day EMA. It also includes a 9 day MA which is the signal line.
How to Use MACD
- Zero line. A signal to buy is when the MACD histogram rises above 0 while a signal to sell is when the MACD histogram drops below 0.
- MACD histogram and signal line crossover. When the MACD histogram is above the signal line, the rise in price is probable. A sell signal is identified when the MACD histogram drops below the signal line.
- MACD may differ with price action such that as price rises, the MACD falls. In this scenario, price direction has not been confirmed thus price may fall. When price drops and MACD rises, the price may rise.
5. Stochastics Oscillator
Developed by George Lane, the stochastics oscillator determines whether the market is overbought or oversold. The stochastics oscillator consists of two lines (%K and %D) and has a scale from 0 to 100.
How to Use Stochastics Oscillator
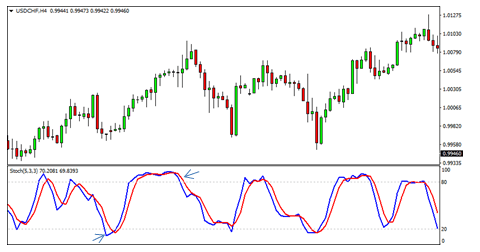
The overbought zone is above 80 while the oversold zone is below 20. When both lines are in the overbought zone, then it is an indication that the price may fall. A sell signal is when the lines cross below the 80. When both lines are in the oversold region, then there is a probability of price rise. Buy when the lines cross above level 20.
6. Fibonacci
Leonardo Fibonacci was a skilled mathematician who discovered a series of numbers whose ratios are used in chart analysis today. The Fibonacci series is as follows;
0-1-1-2-3-5-8-13-21-34-55-89-144-233…
The numbers in the series are derived by adding the two numbers before them. For example;
(1+1=2), (21+34=55), (89+144=233)…
The ratios are computed by dividing one number and the prior number. For example;
(89/144=0.618), (34/55=0.618)…
Other ratios are acquired by dividing the alternate figures. For example;
(34/89=0.382), (13/34=0.382)…
The other ratio is acquired by dividing one number and the other three places away in the series. For example;
(34/144=0.236), (55/233=0.236)…
- Popular Fibonacci Retracement Levels are; 0.236, 0.382, 0.500, 0.618…
- Popular Fibonacci Extension Levels are; 1.382, 1.618…
The Fibonacci retracement and extension levels are used as support and resistance levels. Fibonacci extension levels can further be used as take profit levels.
How to Use Fibonacci
In an uptrend, when setting up the indicator, you plot starting from the swing low to the recent swing high.
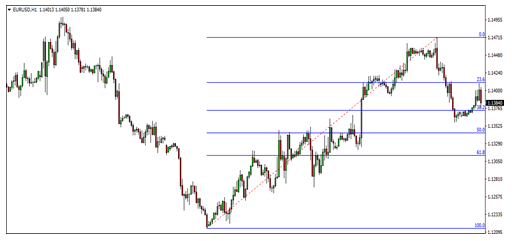
In a downtrend, you plot the indicator from the swing high to the recent swing low.
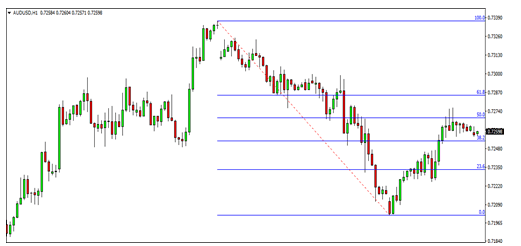
The most important levels in Fibonacci are 61.8%, 50%, and 38.2%. The market may retrace at this points before proceeding with the original trend.
7. Parabolic SAR
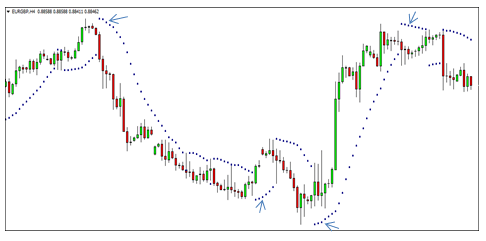
Developed by Welles Wilder (developer of RSI indicator), the Parabolic Sar follows the price direction of an instrument. It is mostly used to signal the ending of a trend. Graphically, this technical indicator appears as successive dots on the chart either below or above the candlesticks.
How to Use the Parabolic Sar
Buy when three dots are formed below the candlesticks and close when three dots are formed above the candlesticks. Sell when three dots are formed above the candlesticks and close the trade when three dots are formed under the candlesticks.
Final Thoughts
Technical indicators are significant to traders whether novice or experts. However, no technical indicator can be successful on its own. Therefore, it is necessary for traders to include 2 or more indicators in their trading plans for better results. When selecting indicators to use, here is what to look for;
- An indicator that follows the trend.
- One that can confirm a trend.
- An indicator that identifies overbought or oversold market.
- An indicator that gives signals to enter or exit the market.
Traders use different indicators in their trading strategies. Hence, use the ones that work best for you.
Ready to learn more about forex trading? For more articles, check out our education section.
